Monday, June 27, 2011
Ionizing Radiation

Friday, June 10, 2011
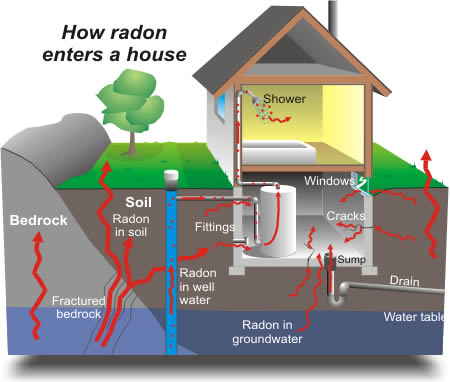
What is Radon
- cracks at concrete floor-wall junctions
- gaps in the floor
- small pores in hollow-block walls
- sumps and drains.

- improving the ventilation of the house
- avoiding the passage of radon from the basement into living rooms
- increasing under-floor ventilation
- installing a radon sump system in the basement
- sealing floors and walls
- installing a positive pressurization or ventilation system.

- Not everyone exposed to even high levels of radon will contract radon induced lung cancer.
- All radon levels can be lowered, which lowers the risk assessment.
Friday, May 20, 2011
Gamma Spectrometry - Efficiency Calculation for K-40
Gamma Efficiency for K-40
Activity
Define activity, A = Number of spontaneous disintegrations in a source in one second.
Unit of activity, A = Bq (Becquerel)
N = Number of atom for K40
λ = Decay constant
How to calculate Activity and efficiency of K40 in KCl for Gamma Spectrometry
(eg. Standard KCl, 400g was used to calibrate the gamma spectrometry)
Wednesday, May 4, 2011
Statistic - Q test
Theory
In a set of replicate measurements of a physical or chemical quantity, one or more of the obtained values may differ considerably from the majority of the rest. In this case there is always a strong motivation to eliminate those deviant values and not to include them in any subsequent calculation (e.g. of the mean value and/or of the standard deviation). This is permitted only if the suspect values can be "legitimately" characterized as outliers.
Usually, an outlier is defined as an observation that is generated from a different model or a different distribution than was the main "body" of data. Although this definition implies that an outlier may be found anywhere within the range of observations, it is natural to suspect and examine as possible outliers only the extreme values.
The rejection of suspect observations must be based exclusively on an objective criterion and not on subjective or intuitive grounds. This can be achieved by using statistically sound tests for "the detection of outliers".
The Dixon's Q-test is the simpler test of this type and it is usually the only one described in textbooks of Analytical Chemistry in the chapters of data treatment. This test allows us to examine if one (and only one) observation from a small set of replicate observations (typically 3 to 10) can be "legitimately" rejected or not.
Q-test is based on the statistical distribution of "subrange ratios" of ordered data samples, drawn from the same normal population. Hence, a normal (Gaussian) distribution of data is assumed whenever this test is applied. In case of the detection and rejection of an outier, Q-test cannot be reapplied on the set of the remaining observations.
In statistics, Dixon's Q test, or simply the Q test, is used for identification and rejection of outliers. This test should be used sparingly and never more than once in a data set. To apply aQ test for bad data, arrange the data in order of increasing values and calculate Q as defined:

Where gap is the absolute difference between the outlier in question and the closest number to it. If Qcalculated > Qtable then reject the questionable point.
EXAMPLE:
For the data:
0.189, 0.167, 0.187, 0.183, 0.186, 0.182, 0.181, 0.184, 0.181, 0.177
Arranged in increasing order:
0.167, 0.177, 0.181, 0.181, 0.182, 0.183, 0.184, 0.186, 0.187, 0.189
Outlier is 0.167. Calculate Q:
With 10 observations, Qcalculated (0.455) > Qtable (0.412), so reject it with 90% confidence. However, at 95% confidence, Qcalculated (0.455) < Qtable (0.466).
Therefore keep 0.167 at 95% confidence or reject it at 90% confidence.
TABLE
This table summarize the limit values of the test.


